


I wish I had a bitcoin for every article and research report that has crossed my desk in the last three years about the looming copper supply crisis. (I’ve written about three of them). I’d be richer than Satoshi Nakamoto. Well, maybe not quite. But you get my point.
Nevertheless, there is a chance said narrative is now becoming reality. Bank of America just put out a research report, entitled “The copper supply crisis is here”.
Meanwhile, the copper price is butting up against all-time highs and looks ready to break out.
In today’s piece I shall:
Look at copper’s price action over the short and long-term
Give you a quick overview of the the copper market
Look at the current supply and demand situation
Consider various ways to play copper
And, finally, give you my take on things and explain how I’m playing it.
1. Copper price action
So let’s start with a long-term chart, going back to 1980.
You can see how the $4.20-4.60/lb area has been resistance for a long time - since 2008. We broke out briefly above during the “Covid boom” and, after a nasty correction, are back retesting those levels now.
From a price action point of view, I see parallels with $1.45/1.50, which proved resistance for 25 years - from 1980 to 2005. Once copper broke through, it launched north of $4 in 2006. There have been bull markets and bear markets in the 18 years since, but nothing like that move from 2001 to 2006.
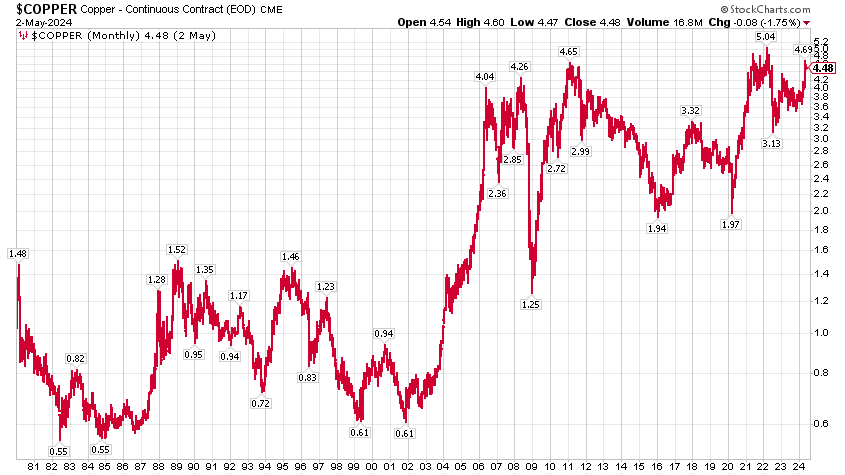
The question is: has this rally got legs? Do we break out above and head higher, or have we hit the wall again?
Analysts at Goldman Sachs think we move north. Higher prices are the only way, they say, of encouraging more metal to a market that is short of supply. They have put a target of $15,000/tonne ($6.75/lb) - a c.50% rise from current prices - for next year. Here’s what they had to say (warning: their prose is clunky): “The path to our average $15,000/t price for next year reflects the necessary price level needed to generate requisite scrap and substitution effects to limit the deficit to a level which metal stocks in the system could solve. If prices remained close to current levels, the absence of those scrap and substitution effects would result in a deficit over 1Mt next year, which simply is not feasible on the available stock level.”
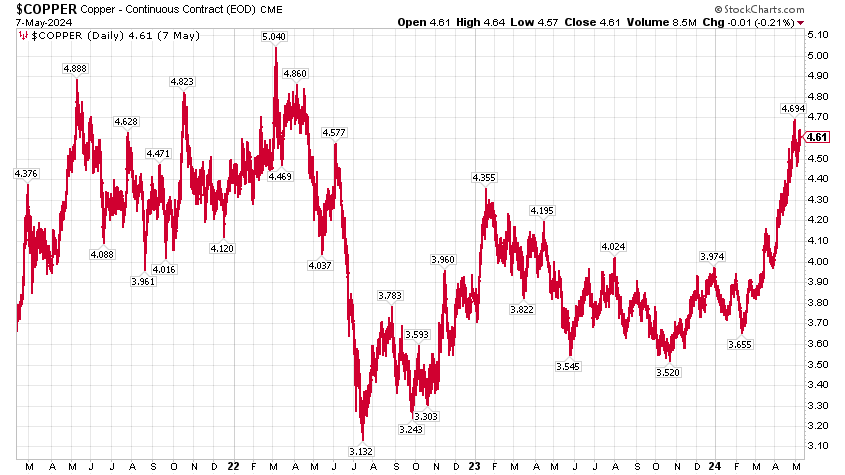
Let’s take a look at the three-year chart now. You can see the surge then the collapse following the Ukraine invasion. we have been making higher lows since 2022, which is good thing.
Take note: copper collapses often start seem to start in April-May, ie now.
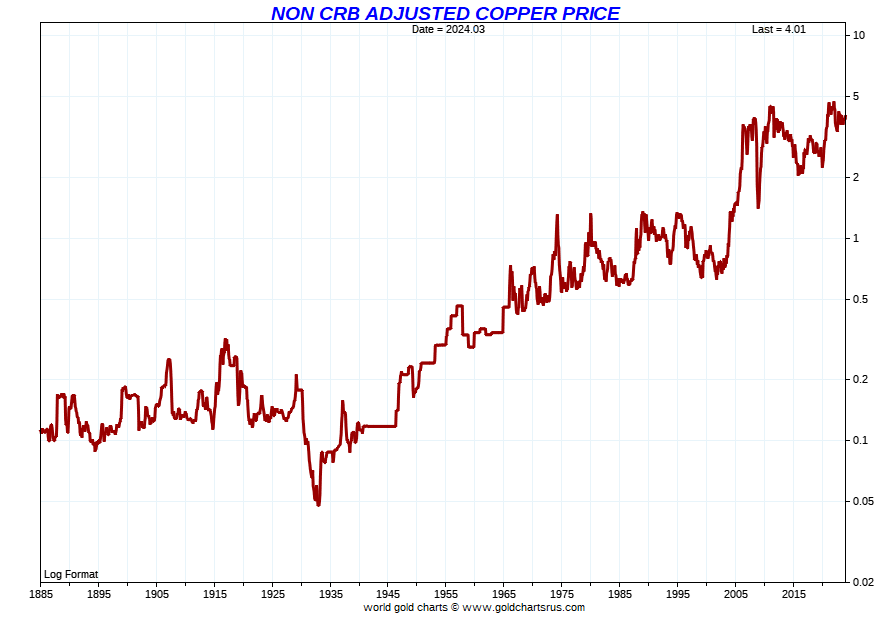
If you want a really long-term chart of copper, how about this? Here are copper prices going all the way back to the 19th century, when you could buy a pound of copper for 10c. Those were the days.
2. Copper: the metal and the market
Many argue that it is the first metal human beings used (there is a copper pendant that dates back to 8,700BC). I argue that it’s gold, but we can talk about that another time.
Today copper is the third most used metal in the world, after iron and aluminium. Its main use is in wiring, which accounts for about 60% of demand. Piping and roofing make up another 20%, machinery about 10%, and “other” the final 10%. Overall copper demand is 65% electrical, 25% industrial and 10% transportation. The big growth area today is in so-called green tech and the electrification of everything.
Because copper has so many uses within an economy, it has become a barometer of economic health, earning the nickname, “Dr Copper – the metal with a PhD in economics”.
The country with the biggest reserves and by far and away the biggest producer is Chile, producing almost six million tonnes annually, or 28% of annual global supply. Next is its neighbour Peru (12% of global supply); China (1,700 tonnes, 8%); the Democratic Republic of Congo (1,300 tonnes, 7%); and the US (1,200 tonnes, 5%). Between them those six nations account for 60% of global supply.
Surprise, surprise, China is the world’s largest consumer of copper and, despite it also being the world’s third-largest producer, is a net importer. 54% of world copper demand is Chinese. That’s a quite astonishing number, and it explains why copper analysts obsess over Chinese demand numbers. China’s internal production can’t meet its own internal demand, let alone what it needs for its exports’ manufacture, and between 2005 and 2020 it spent more than $56 billion securing overseas copper assets.
Europe is the next biggest user, at around 15% of demand, followed by the Americas, the US especially, which accounts for another 11% of demand. Total annual demand is around 28 million tonnes.
Copper costs around $10,000 per tonne, so this is a $280 billion market.
3. The current state-of-play
Bank of America describes a “deceleration in mine supply”, while Goldman Sachs have increased its deficit forecast estimating “a 454kt metal deficit for this year and a 467kt metal deficit for 2025.
“With peak supply now fixed on the horizon mid-decade and already extreme tightness in concentrate creeping into the metal market, the question has now become how high will copper prices have to trade to maintain market function”.
Just as “Mine supply is also increasingly constraining refined production”, BoA notes that in China “apparent demand (refined production + net imports - inventory changes) has rallied by 23% YoY YTD, partially because spending on the green economy has held up.”
China housing demand, which accounts for about a third of Chinese copper use, does seem to be on the slide, but this has been more than offset by green spending, which is putting upward pressure on copper demand, even with EV spending coming off a little. (Newer model EVs don’t require as much copper as previous models, even if an EV still requires way more copper than a petrol or diesel vehicle).
Beyond China and global electrification, other sectors worldwide have been adding to consumption, especially data centres, with the rapid growth of AI and crypto, mean increased copper demand, even if the jury is still out on which of fibre or copper cables will ultimately prevail in the cabling within the data centres.
4. How to play it?
I have long-since advocated owning some copper in your portfolio.
There is no shortage of methods, depending on your risk appetite – from futures to exchange-traded funds (ETFs) to spread bets to stocks and shares.
To simply play the copper price, without taking on individual company or mining risk, there is the Copper ETF (LSE: COPA), but this will not make you rich.
Then there are the miners. If you don’t want individual company risk, go for the Global X Copper Miners ETF, the most liquid version of which is listed in New York (NYSE:COPX) with “subsidiaries” in London, denominated in dollars (LSE:COPX) and sterling (LSE:COPG). The latter is probably the best way to avoid forex charges, though you’ll end up paying them by the back door.
London has no shortage of options when it comes to large-cap mining companies. There are the giants: BHP Group (LSE:BLT), Glencore (LSE:GLEN), Anglo American (LSE:AAL), Rio Tinto (LSE:RIO), and Antofagasta (LSE:ANTO).
US-listed Freeport-McMoran (NYSE:FCX), the world's second-largest producer (after Chilean state-owned Codelco) is a purer play than most of the mining giants, Antofagasta aside.
5. My take and what I’m doing
I own a large chunk of BHP in my own portfolio. It is the easiest way to get me broad base metal exposure. (There is a strong case for Glencore as well, although the yield, 2% is not as good as BHP, 5%. I don’t own Glencore).
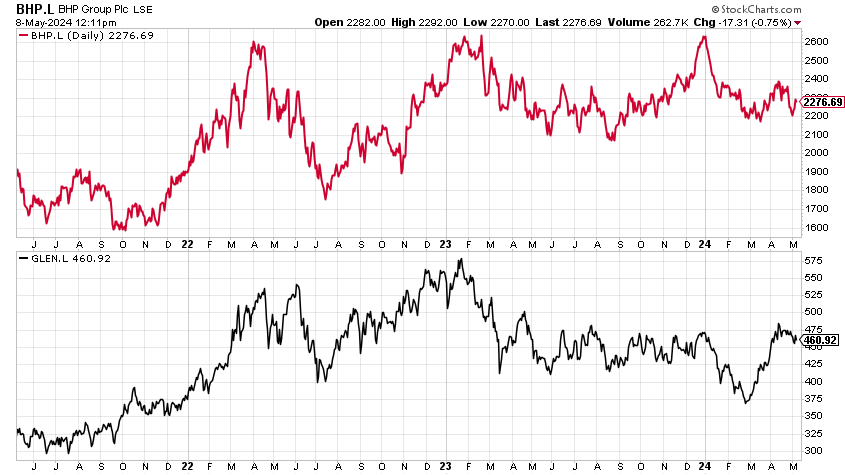
But I have to say, while I am not a seller here, I’m very wary about of copper’s tendency to sell off in May, especially after the run up we have had. I’m bullish over a one-to-three year time frame, but cautious in the short-term. I’d be a happy buyer of BHP at these levels, if I didn’t already own it, because of the diversified industrial metal exposure it brings, but I’d maybe only dip my toe in to the purer plays (and only if I didn’t already have some exposure).
If I’m wrong and Bank of America is right, and copper breaks out, you want to have some exposure already booked in, to save you having to chase.
At the junior end of the market, if you feeling sufficiently kamikaze, I have mentioned three companies in the past, so here’s a quick update.
Arizona Sonoran Copper (ASCU.TO)
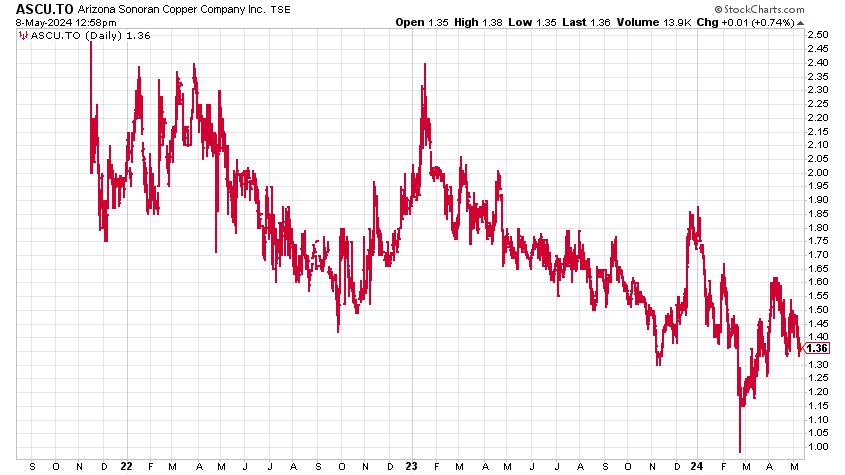
This is not one I own, but it was recommended to me by veteran geologist, Brent Cook, who thinks it is the real deal. Real deal or not, its share price has been sliding since its IPO in 2021 at C$2.35 a share.
At its current price of C$1.36, it has a market cap just shy of C$150 million.
ASCU is putting the past-producing Cactus Mine in Arizona back into production. It is in a prolific copper mining region, has a multi billion pound mineral resource, is a low capex project, with an 18 year mine life that should generate over $US1 billion of cash flow, assuming current copper prices or just below. It has a mineral resource estimate there of 3 billion pounds of copper. Rio Tinto, via its Nuton Technologies subsidiary, own 7%.
The location of the mine, the economics, the scale all make it attractive. The problem with these development plays is that progress is so slow and vast amounts of capital get burnt. There is always a chance of a take-out, I suppose, but the chart is telling and its ugly. Maybe C$1 was the low in February.
Amerigo Resources (ARG.TO)
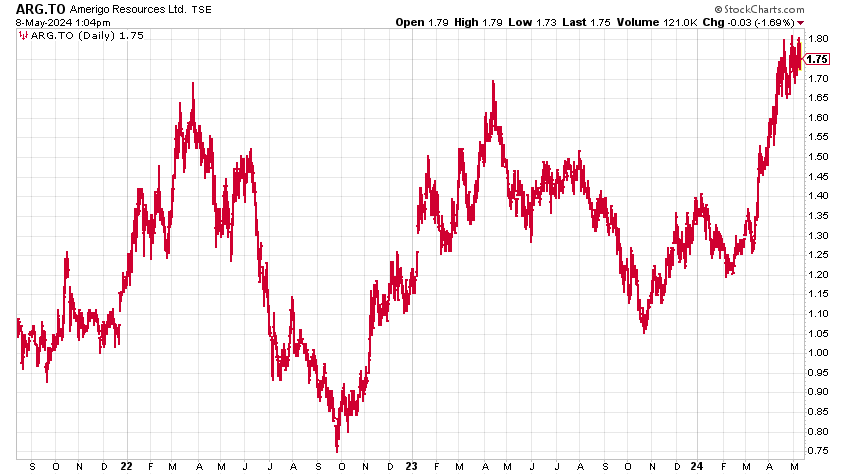
Amerigo Resources has done rather better. It produces copper from the waste material of state miner Codelco’s enormous, underground El Teniente mine. (El Tenienete began producing in 1905 and has a predicted minelife up to 2082, so we do not need to worry that the copper will run out).
Amerigo has a market cap of C$290 million and pays an annual yield close to 7%.
I don’t own this one either - wish I did. Copper price goes up, so do its profits.
QCCU Copper (QCCU.V)
This is the one I do own, the reason being its small market cap - C$22m - gives it optionality. That said, it appears to have gone to sleep.
QCCU is developing a large copper project in Quebec, “the highest grade open pit mine in Canada”. I thought its mineral reserve update would be a big catalyst for the stock but decent though it was (2 billion pounds plus of copper equivalent - it has some gold and silver too) it did very little. We now have to wait for a preliminary economic assessment and feasibility studies to come out later in the year. It has some $7m in cash so it shouldn’t have to dilute too soon.
But on a value basis, compared to ASCU, for example, you have to say it’s more compelling.
It is going ever sideways, but as they say: “The bigger the base, the higher in space”. One day I am hoping this chart will spring up. Resources of this size and quality in safe jurisdictions like Quebec don’t come around very often. Accessibility and infrastructure are good, though there are suggestions it will have some social issues with local communities to get past. Maybe thats what is holding the stock back.
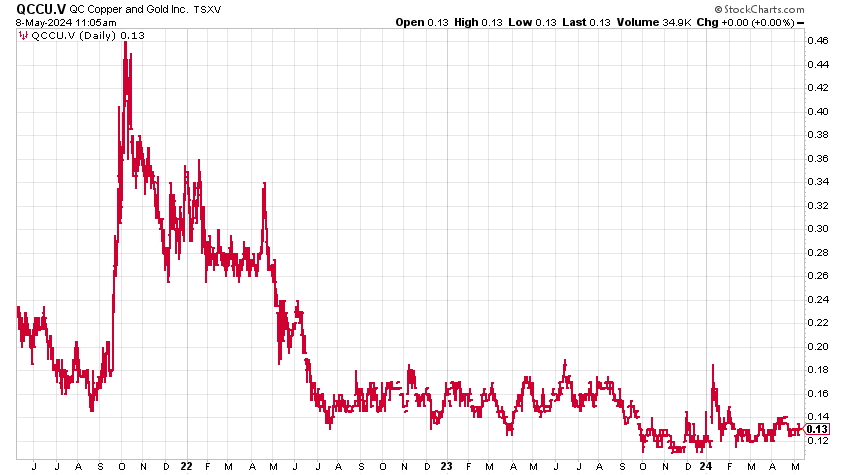
I really don’t recommend speculating in juniors unless you are prepared to swallow some pain. So much more seems to go wrong than right. But QCCU is the small cap one I own. At 12c, there is plenty of upside …
Thanks for reading and for being a subscriber.
Until next time,
Disclaimer:
I am not regulated by the FCA or any other body as a financial advisor, so anything you read above does not constitute regulated financial advice. It is an expression of opinion only. Resource stocks are famously risky, especially small and midcaps, so please do your own due diligence and if in any doubt consult with a financial advisor. Markets go down as well as up. Especially small and midcap resource stocks. I do not know your personal financial circumstances, only you do, but never speculate with money you can’t afford to lose.
Please do not share, copy, reproduce or distribute any part of this report without the express permission of the author.