



Something of a thought experiment today, motivated by the fact that I don’t want to go through another bear market in mining. I’m done with them. The false dawns, the endless grinding declines, the frustration.
You might remember me saying, mid bear market a few years ago, “One more bull market and I’m done.”
So the question I’m asking today is, “when can we expect this bull market to end?” It might already be over, for all I know. Or there might be another five years in the tank.
I’m asking this question because I’m finding myself more and more tempted by high-risk mining exploration plays. I’m seeing value in companies that today have a market cap of C$50 million that a year ago I would have been more reluctant to invest in when their market caps were under C$10 million.
Last week I bought one. I like it. But the way I bought it ignored all the risk-aversion built up over ten years of bear market.
If we are in a secular bull trend for metals, then companies like this will do very well. But come a bear market, they will grind lower and lower, eventually reaching a point where they trade for little more than their cash value.
My broad thesis for gold and silver, as you know, is that we trade sideways for a year, while the market works through the excesses of 2025. A mid-cycle pause, so to speak, before we eventually go to the $7 to $10,000 by the end of the decade. At present I feel more bullish about base metals such as copper and zinc. Rising prices here will preserve the bull market in mining more generally.
But this is just one writers’ thesis.
The mining cycle
So today we are going to study two long-term charts.
I have got a fantastic chart of the copper price, adjusted for inflation, going all the way back to 1900. Copper is a good proxy for industrial metals and to some extent gold and silver as well. There is a lot to learn from this chart, some of it quite unexpected.
Yes, mining and mining methods have changed over the years. Grades used to be a lot higher (there were higher amounts of metal in the rock) but this is offset by improved extraction methods meaning lower grade rock is now economic. Bottom line the world is consuming more copper than ever before.
The mining cycle however still exists. Today, if anything it takes longer than ever before. If there is a shortage of supply of metal resulting in a price rise, it still takes many years and a lot of investment to increase supply from existing mines. Companies, which tend to be risk-averse, have to be persuaded for example that the higher price warrants the extra investment - that the higher price is here to stay. Once the investment is made it can take a long time to build out the mine. Then there are regulators to get past. This can take years too.
As for new mines it can take over a decade or more to take a mine from discovery to production. Making the discovery in the first place can take years too.
All the while there is a shortage of metal and prices keep on creeping up.
Eventually there will be an excess of metal and prices start falling again. Then all the mines need to be shut down. That takes time. Once they’re shut and everyone has lost their shirt, there is considerable reluctance to ever do anything again (see my opening comment)
Then the metal price starts going up again.
The world may be unrecognisable from the first half of the 20th century. The mining cycle is unchanged however.
So what do these cycles actually look like over the long term? And more importantly, where are we now?
To answer that, we need to look at two charts. One, as I say, goes back to 1900. The other is the oldest mining index there is.
One thing to keep in mind as you look at these charts: the biggest gains in mining don’t come at the end of a bull market. They come early.
The Barron’s Gold Mining Index (BGMI) was originally put together by Barron’s magazine in 1938 to track the performance of 25 mining companies. (Barrons used to publish weekly values for steel, automobile manufacturing, gold mining and other industries)
Here is the index, with red and blue representing bull and bear cycles, going back to 1938. (Broadly speaking mining was a good place to be in 1930s - before this chart - after the stock market crash of 1929 eventually bottomed in 1932).
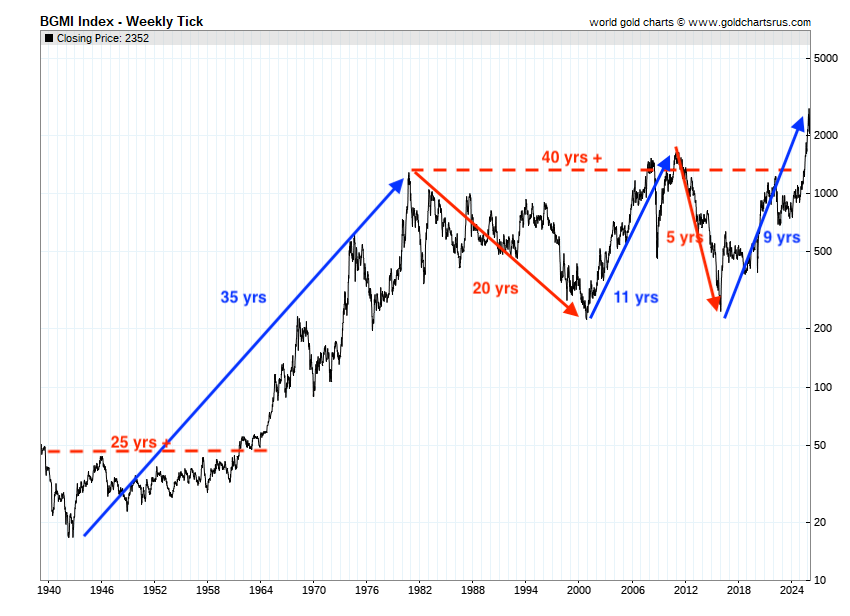
But you can see there was no break-out until 1965. So at least 25 years of range-trading.
Once the break out occurred, it was bull market for 15 years until 1979. But there were two huge shake-outs along the way - one from 1968-1970, the other from late 1974-1977.
Then from 1980 to 2001 another 20+ years of range-trading and decline.
That 2001–2011 bull market did break out in real terms, but the move ultimately failed to sustain itself.
Another bear market from 2011-2015.
And then I guess you’d say bull market from 2016 but again with two huge shake-outs 2018 to 2020 and 2022-2024 (the one when I declared one more bull market and I’m done).
But here’s the thing. We only got a proper break-out from that 1980 high last year - 45 years on
You can see just how long these cycles are.
Now let’s look at copper
And my goodness me - how long does it range trade for?
The cycles are marked in red and blue, as before
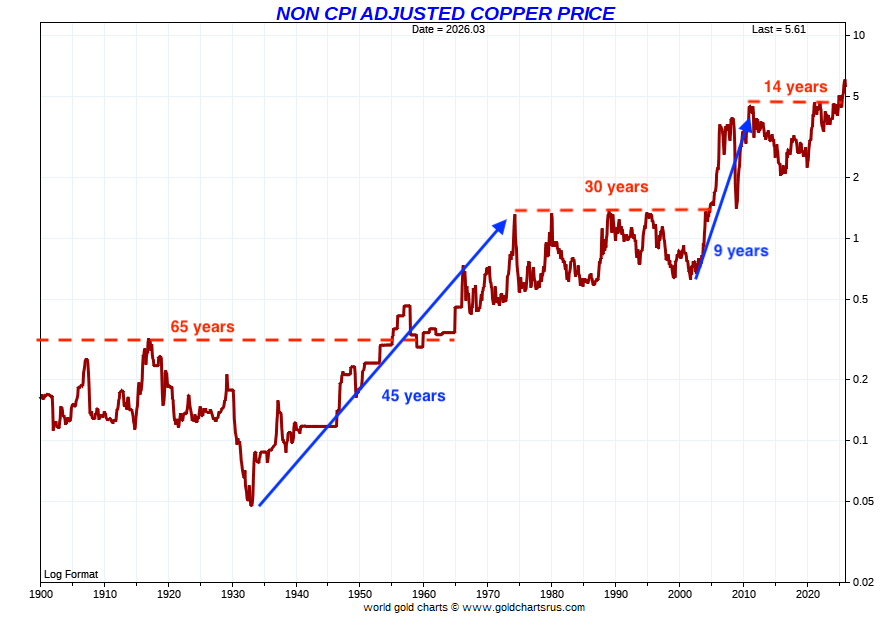
That’s the nominal price of copper, it might be useful to look at the CPI adjusted price, for obvious reasons.
You can see just how long the cycles are.
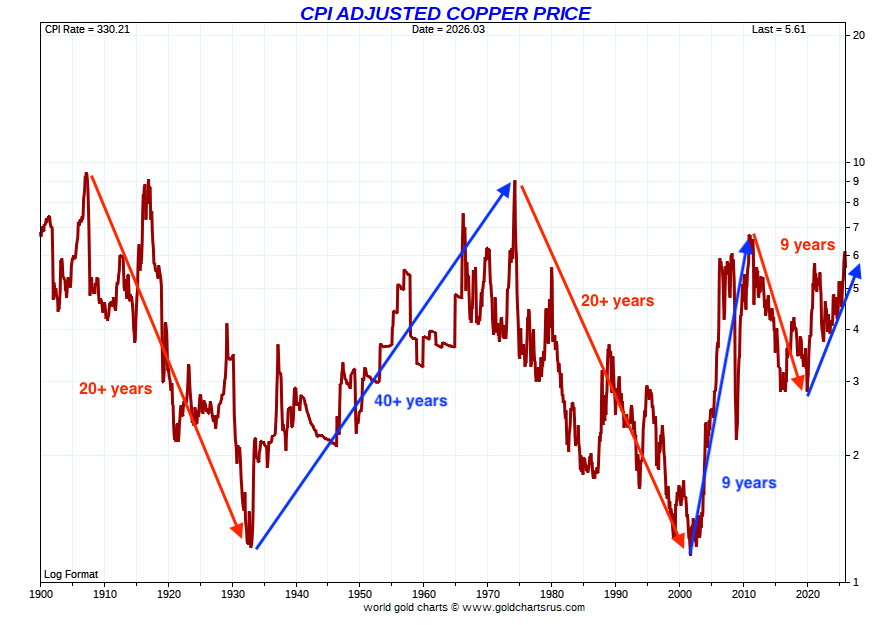
With shake-outs along the way you are basically looking at a bear market from 1907 to 1932.
A bull market from 1932 to 1975, which, in CPI-adjusted terms, peaked at the 1907 high.
25+ years of bear market from 1975 to 2002.
The 10-year bull market of the noughties, followed by a 10 year bear.
In CPI-adjusted terms copper is still trading below the 2011 high - never mind the 1975 and 1907 highs.
The conclusion is that this bull market still has legs, but also that mining cycles are longer, messier and more deceptive than most investors expect.
However, mid-cycle corrections (such as we are currently seeing in gold) are to be expected. The longer-term bull market thesis is still intact.
There is one other observation I would like to make, and I believe it’s an important one.
And it leaves me in an awkward position.
I find myself taking more risk just as the part of the cycle where the biggest gains are typically already behind us.
While mining cycles are often longer than people think, equity performance is heavily front-loaded. That’s when the biggest gains are found, coming out of the bear markets. Most investors arrive half way through, so miss the early big gains and then get caught out when the thing turns.
I know that’s what happened to me in the 2000s. Big money was made from 2001 to 2005/6. I only really got involved mid decade and while 2006-11 was great, there weren’t quite the returns seen from 2001-6.
So the ten baggers of last year, such as we enjoyed with Sierra Madre (SM.V)? It’s still possible to find them lower down the food chain in the explorers, where there is greater risk, but they won’t be as common.
Until next time,
Dominic
Disclaimer:
I am not regulated by the Financial Conduct Authority (FCA) or any other regulatory body as a financial advisor. Therefore, any information provided in this newsletter does not constitute regulated financial advice. It is solely an expression of opinion. Small-cap stocks are inherently risky. Please conduct your own due diligence and consult with a financial advisor, if you have any doubts. Remember, markets can both rise and fall, especially in the case of small and mid-cap stocks. I am not aware of your individual financial circumstances, so only invest money that you can afford to lose.


