

The Truth About House Prices: UK Regional House Prices Measured In Gold & Silver
Plus US House Prices in Silver too. Lots and lots of charts.

Last week’s post about wages and house prices but measured in gold proved extremely popular. You would think it’s a niche subject, but it’s one that always seems to chime with people, and I am constantly surprised by the interest it generates.
So, today, following all the messages I received, I’m doing two things. First, we’ll look at average house prices in the UK and US, but measured in silver. Then, we’ll explore UK regional house prices in both gold and silver. There are a lot of charts, so I’ll keep the text brief. Special thanks to Nick Laird of goldchartsrus.com for the charts.
Before we start, two reminders. One I am giving one of my lectures with funny bits at the Edinburgh Fringe this August, followed by a short run in London October 9th and 10th to the Museum of Comedy. It’s called Shaping The Earth. Please come if you fancy some lighthearted learning and laughter. The Edinburgh link is here. And the London link is here.
Also, If you are interested in buying gold (or silver) - and you should be - check out my recent report. My recommended bullion dealer is the Pure Gold Company. I also like Goldcore.
US and UK House Prices Measured In Silver

We are not at the 2011 lows, when silver went to $50/oz, just yet, but there has been a definite turnaround since 2021 and the ratio is moving lower. The average US home costs 223 ounces of gold or 17,000 ounces of silver.
Same applies to the UK.

The average UK home costs about 150 ounces of gold, or 12,000 ounces of silver. In 1980, during the Bunker Hunt mania, it fell to just 1,000/oz. I’d be surprised if we got there again, but you never know.
If nothing else, boy do these charts show the value of asset allocation.
UK Regional House Prices Measured in Gold and Silver
I present these charts without much comment, as I think between today’s piece and last week’s, you’ve go the point: measured in sound money, house prices are not unaffordable. You should, therefore, use sound money such precious metal or bitcoin as your savings vehicle. You are being robbed by the fiat money system. It is evil and, if your government really cared about you, would be criminal. (If you are interested in all this stuff, read Life After the State - Why We Don’t Need Government (2013), my first book - it is now back in print - with the audiobook here: Audible UK, Audible US, Apple Books. I recommend the audiobook ;)
Right, then, enjoy perusing these charts. We’ll start with Wales, which, in gold, is hitting all-time lows!
Wales


All time lows for Wales. Amazing.

The South West
Similar story to Wales.


I am making these freely available to all because I think the message is so important. The more people that understand the damage done by fiat, the quicker the system can be ended. If you are feeling similarly benevolent, please consider upgrading your subscription. :)
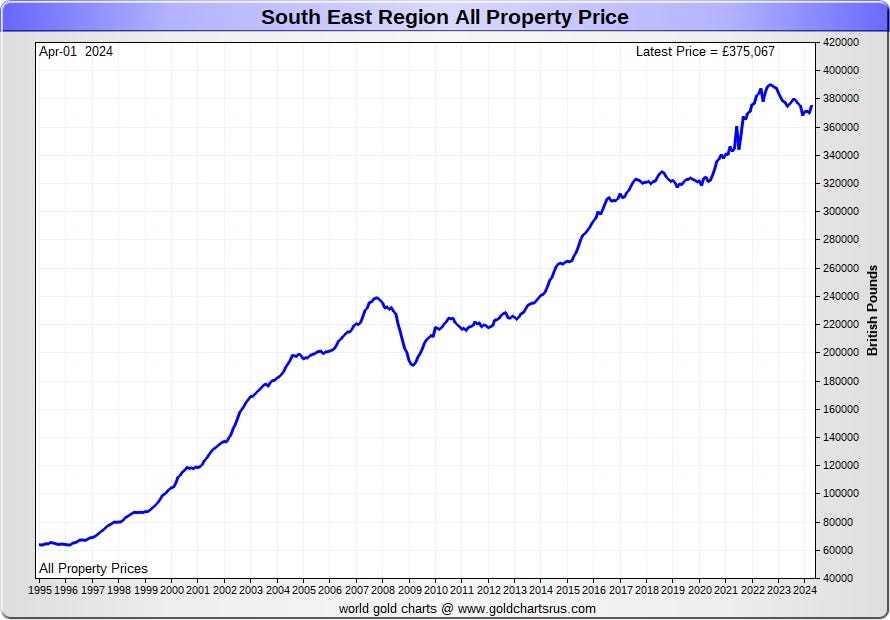
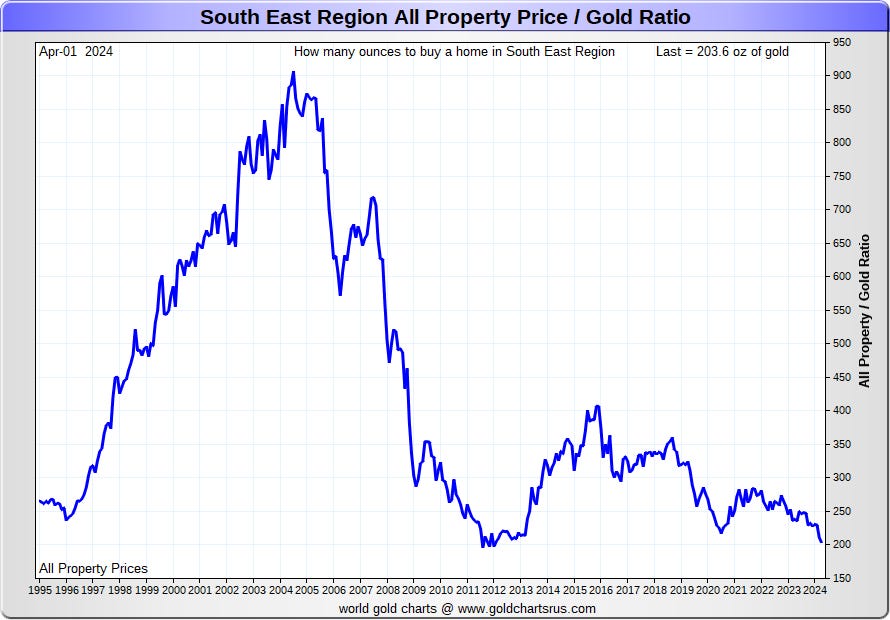
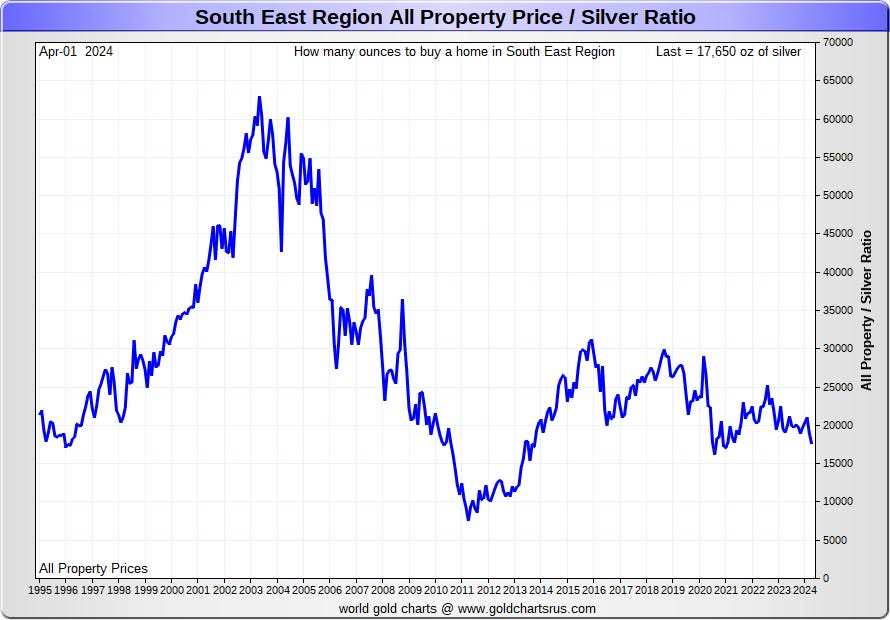
The South East
Greater London

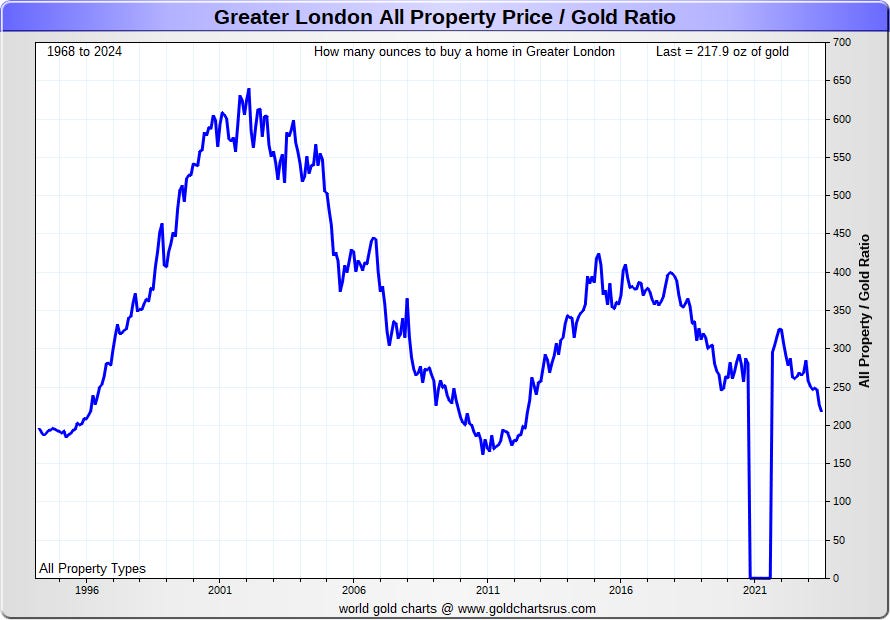
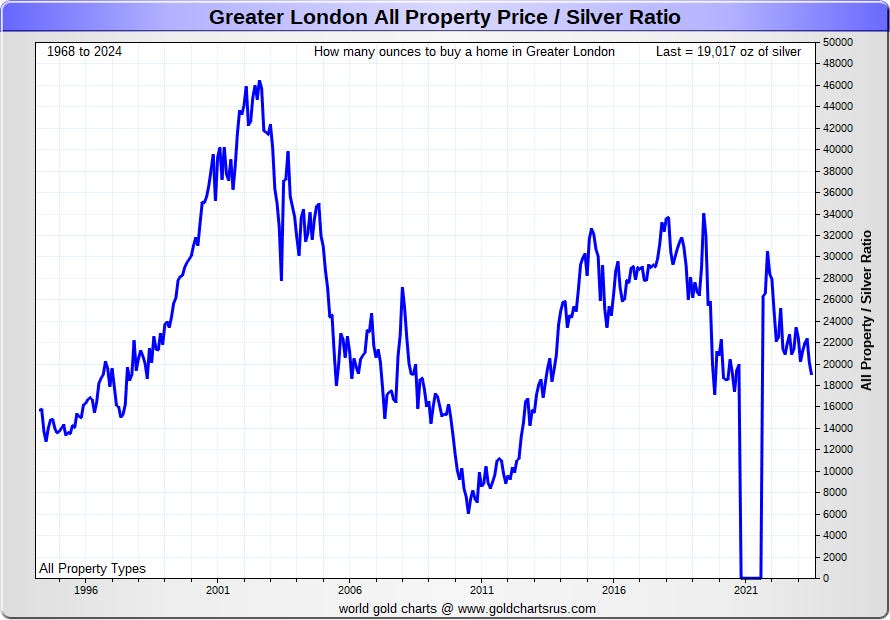
For individual London boroughs, click here.
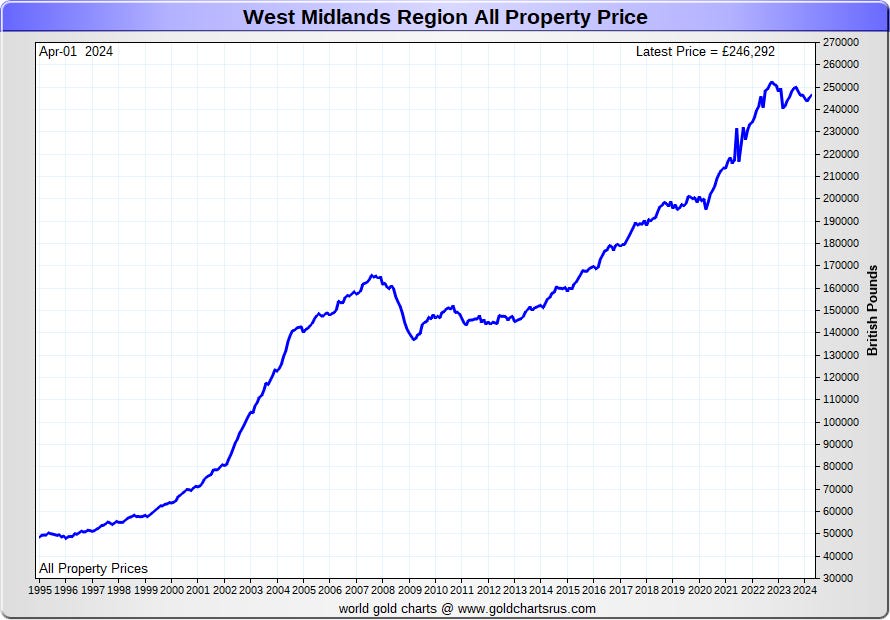
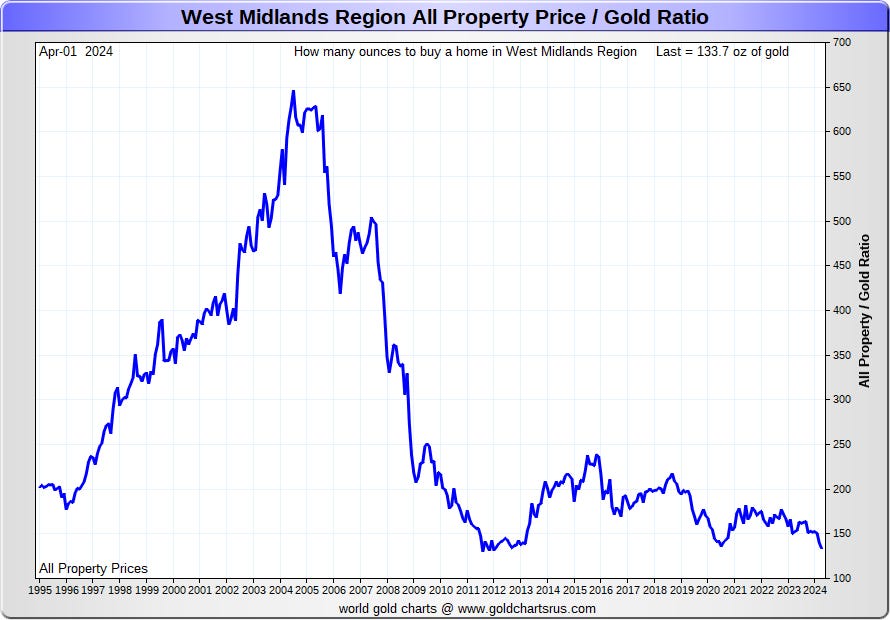
West Midlands

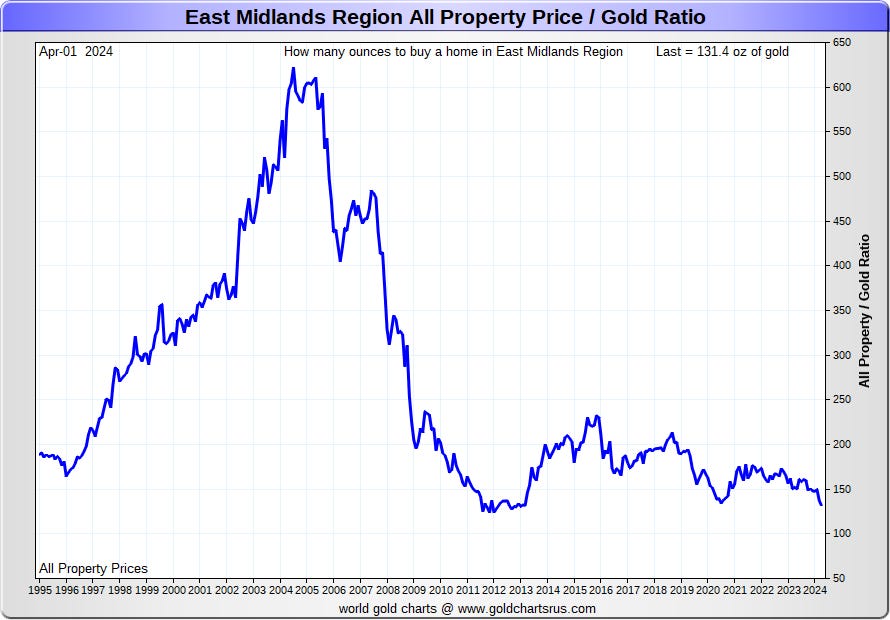
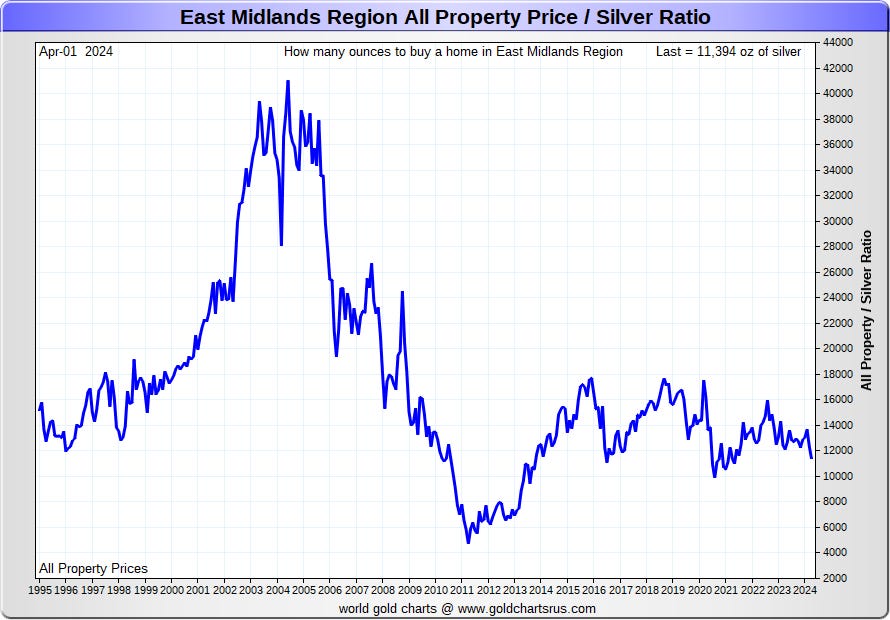
East Midlands

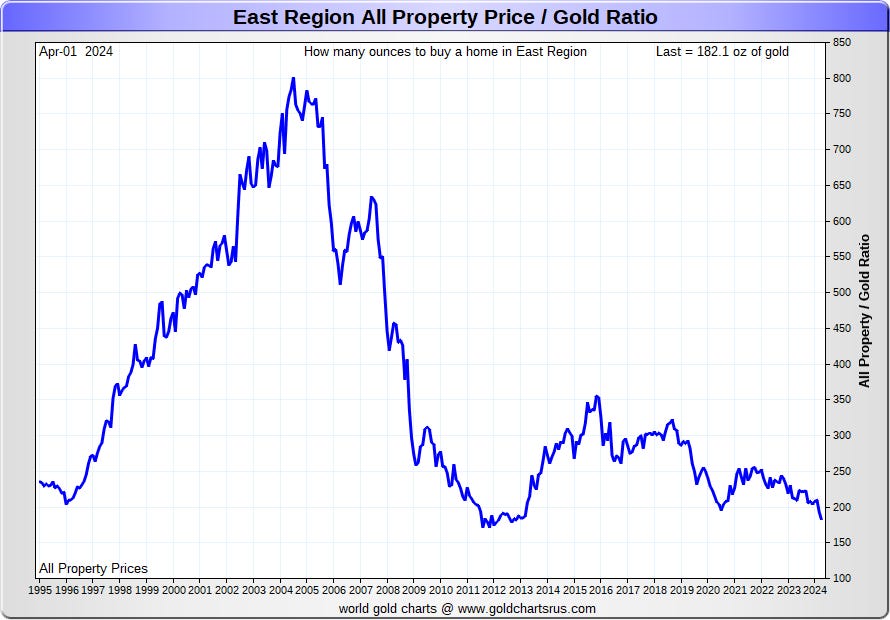
East England


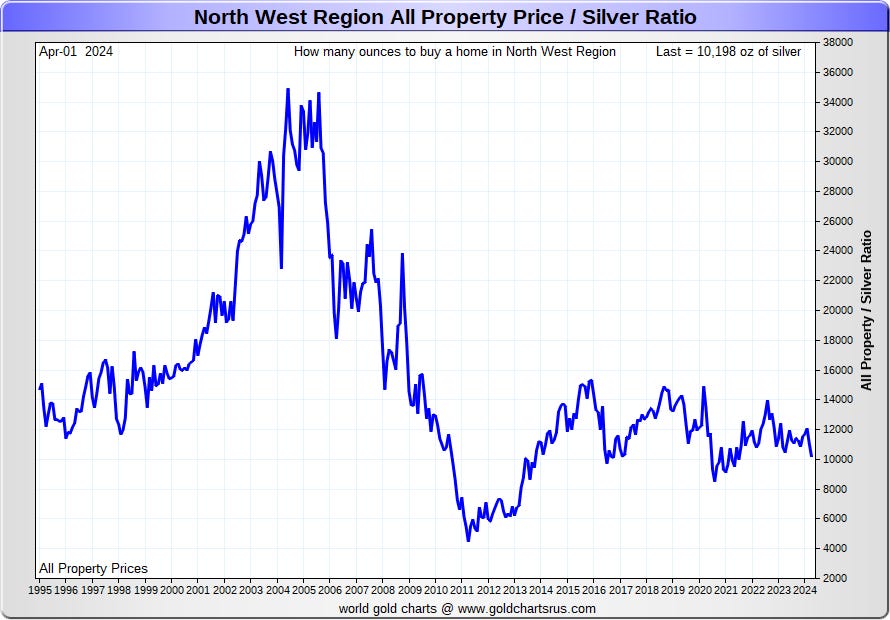
The North West


Yorkshire and the Humber


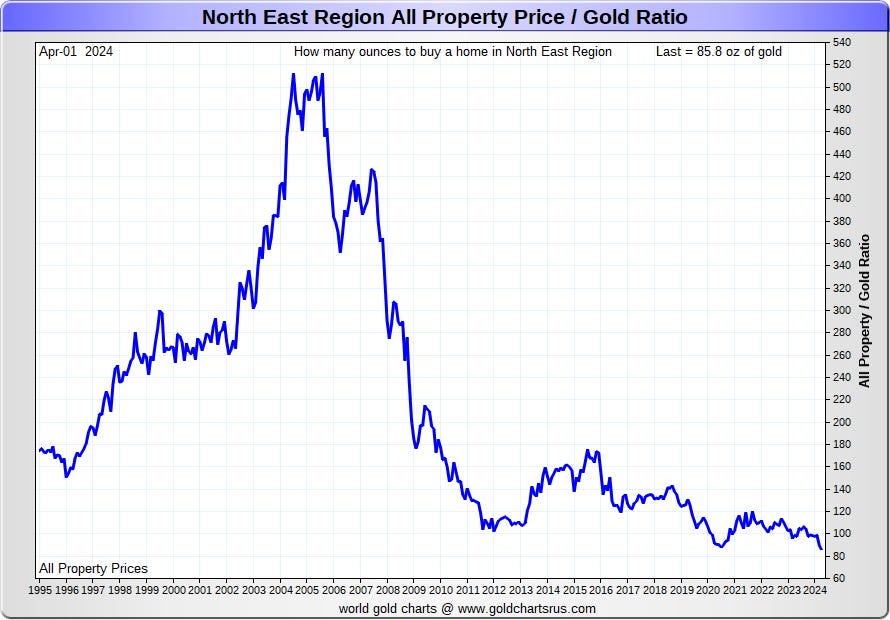
The North East


I don’t have data for Scotland or Northern Ireland.
Don’t forget my lighthearted lecture on the history of mining. The Edinburgh link is here. And the London link is here.
And if you are interested in buying gold (or silver) - and you should be - check out my recent report. My recommended bullion dealer is the Pure Gold Company. I also like Goldcore.
Until next time,
Yes, indeed price and value are very different things.
Dominic Frisby has high value, but you can get him at a very low price
Stunning charts. They remind us of the strength of gold and the inherent weakness of fiat.