


Before we get started today, if you haven’t already seen it, check out my interview with Alex Langer of Sierra Madre. There could be quite an opportunity setting up with this silver mining company.
There are just a handful of tickets left for my lecture with funny bits about gold in London on October 19. I’m not sure when I will next be doing this show so book early to avoid disappointment and all that.
And, if you haven’t yet seen Programmable Money, I think you will be amused.
Right, house prices. They are in free fall …

“Fastest fall in 14 years” said the Guardian on the back of the latest numbers from the Halifax, which reported year-on-year falls of 4.7%. The Telegraph was similarly gloomy. ”London house prices slump,” said City AM. “6 months of consecutive declines,” noted the FT. The latest Nationwide numbers showing declines of 5.3% are even worse.
But, some context. Here are house prices since 1950. Relentless. The current declines are a mere blip, though it may not fee like that.

I have long-argued that houses are, in effect, financial assets whose prices are largely determined by the availability and cost of money. When lending is loose and money is cheap, house prices rise. When lending tightens and the cost of money goes up, so do house prices fall. With rising rates, the reality of this is now plain to see.
It would seem that the housing market peaked in summer 2022. I know nominally it was November, but in reality it will have peaked 6 to 9 months before that because of the various lags in house price data reporting. (There is a chap called Charlie on Twitter, who is very good on this by the way). Housing data lags the market because moving home is such a slow process: you decide to move, you put your house on the market, you wait for a buyer, it takes time to exchange and complete, then there are several months more before the Land Registry actually reports the transaction.
But from August 2022 to August 2023, according to Bank of England data, mortgage lending has fallen by 43%, while the number of approvals is down 36%. Of course house prices are falling.
How far do house prices fall?
The answer to that lies with the Bank of England Monetary Policy committee, gilt markets, interest rates and all the rest of it. Sterling also has issues, which is going to put upward pressure on rates. But with another million or so cheap fixed rate deals coming to end in the next year, and another million the year after that, something like two million households are going to be hit with much higher mortgage costs. Just how much will those costs be?
The genius that is Merryn Somerset Webb, as always, has the answer:
“Mortgage on 350k at 2%: £1484 a month and total payment £445,126. Mortgage on £350k at 5.5%: £2149 a month and total £644,745. To get payment back to £1484, you can only borrow £243k (total payment 447k). And that's why house prices are falling.”
Considerable problems lie ahead.
All in all, I don’t think the worst is over by a long chalk and, a year from now, I think we will see distressed selling, along with opportunities for bargain hunters. This could all have happened in 2008, but the powers-that-be saw fit to suppress rates and print money. Then we got Help to Buy. I don’t quite know what they will do this time around - no doubt something is being planned - but in the meantime it seems we are seeing the beginning of the unwinding of a 30-year, generational bull-market/bubble.
By way of reference, here is the that infamous Jean-Paul Rodrigue illustration of the lifecycle of a bubble. (I used to have this on my wall, I liked it so much). I would argue that we are probably in the fear stage, with the bull trap having come during Covid, but it may be we are still in the denial phase. As with so much academic projection, real life is never quite as neat and tidy.

At the same time, as those of us who were around in 2008 will testify: all ye who call the end of the UK housing market bubble, beware. The housing market has a nasty habit of making bears look stupid.
Some see a correction of 35% or more in nominal terms. Others are more muted at 5-10%. Both are possible. In the short term I think housing goes lower. A 1989-94 scenario looks more likely than 2008-11, though I reserve the right to change my mind, as events unfold.
So to gold
Here you can see gold vs sterling since 1999 when Gordon Brown sold ours for £150/oz or thereabouts. Today, such is the rise of gold (or the decline of sterling more like), we are at £1,500/oz.

Josh Saul of Pure Gold Company has reported to me numerous times over the past year how many buy-to-let and other property investors have been selling real estate and buying gold. When will they flip back into property?
Gold is the oldest money in the world, it is a constant, so I like to take a periodic look at house prices measured in gold. Of course, we do not use gold to buy houses. We use sterling. But as the verse goes:
“Money is a matter of functions four.
A medium, a measure, a standard and a store.”
While gold may no longer have much use as a medium of exchange, as a store of value, a standard of deferred payment and a measure of relative value (ie unit of account) it remains and will always remain a far more effective form of money than fiat, because it is permanent, constant and you can’t print it.
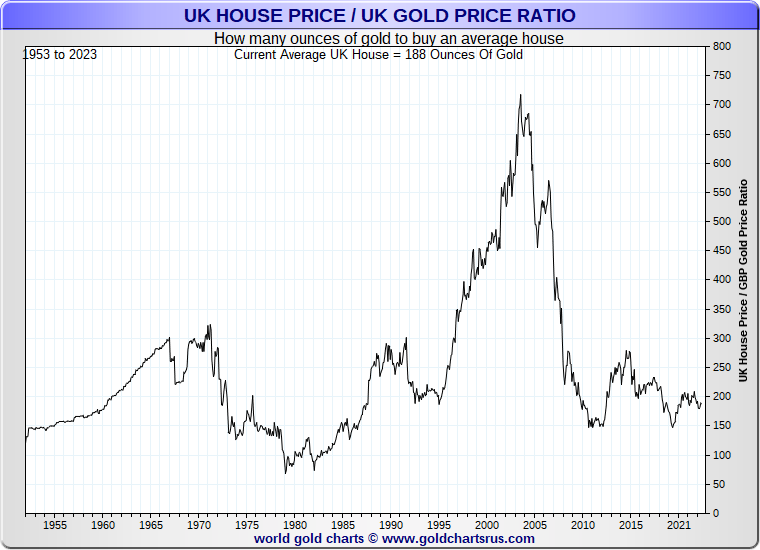
If the average UK house is now £288,000 (it isn’t - it will be lower because of time lags) and gold is £1,500/oz, then the average UK house price in gold is 192 oz.
Here, courtesy of Nick Laird at goldchartsrus.com, we see the cost of UK house prices, measured in gold, since 1950.
It’s a rather different story to nominal UK house prices, as displayed above.
By this measure, the peak of the UK housing market was 2004. Sterling was (relatively) strong at more than $2 . The UK housing market was booming. Gold was sitting around $400/oz.
The depths of the market came in 1979. The UK economy was weak. There was civil unrest. Gold was at the end of its epic bull market of the 1970s when it hit $850/oz. The average UK house could be bought for around 50 ounces of gold.
How much have we been ripped off by fiat ?
If gold is to increase by say 20% against sterling, and nominal house prices are to come down 10%, then those 2008-11 and 2020 lows of 150oz for the average UK house look pretty nailed on.
If house prices come down 30 or 35%, however, as they did in 1989-94, and the gold price were to double, then those late 1970s and early 1980s numbers around 50oz for the average UK house suddenly come into play. Barring a full-blown sterling crisis (don’t rule it out), I’d say that was unlikely.
For no particular reason, other than round-number-itis, I have a target of 100oz.
Of course, the other possibility is that gold falls, and house prices resume their uptrend.
How many ounces of silver to buy the average UK house?
Here, for the silver bugs, is the same ratio but for silver.
Look how cheap houses in silver were in the 1970s. You could get the average UK house for about 1,000oz!

Will silver ever go back to those levels? I doubt it. It has the potential, but, as we know, silver always disappoints.
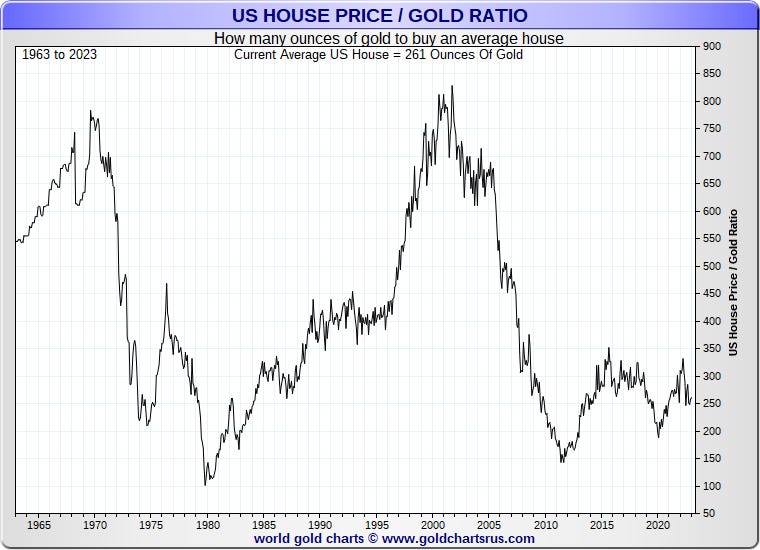
Finally, for American readers, are US house prices in gold and silver.
Post 2008 they almost went back to 1980 levels.
Here they are in silver.


