


There’s a lot more to AI than software.
AI requires electricity, transformers, substations, cooling systems, data centres and more. That all means copper. Lots and lots of copper.
Right on cue, the copper price hit fresh highs last week at $6.68/lb, before pulling back.
So today I am going to take a long overdue look at copper. Was last week’s action just a spike that will soon fade away? Or was it part of something much bigger? TLDR - the second one.
Let’s start with a 50-year chart to give you some historical context.
Copper peaked in the great inflationary blow-off of 1980, before spending the next twenty years doing essentially nothing. The 1980s and 1990s were an age of globalisation, disinflation and cheap commodities. Who cared about hard assets or mining?
Then came the rise of China and the supercycle of the 2000s. China urbanised, industrialised and turned itself into a superpower. Copper exploded higher, peaking in 2011.
That boom then gave way to a long hangover. The 2010s were dominated by tech stocks. Mining died a death. To survive mining companies cut capex, reduced exploration and focused on balance sheet repair rather than growth. That decade of underinvestment laid the foundations of the shortages being revealed today.
Meanwhile, while investors were busy buying software companies and meme stocks, the world quietly decided it wanted to electrify everything.
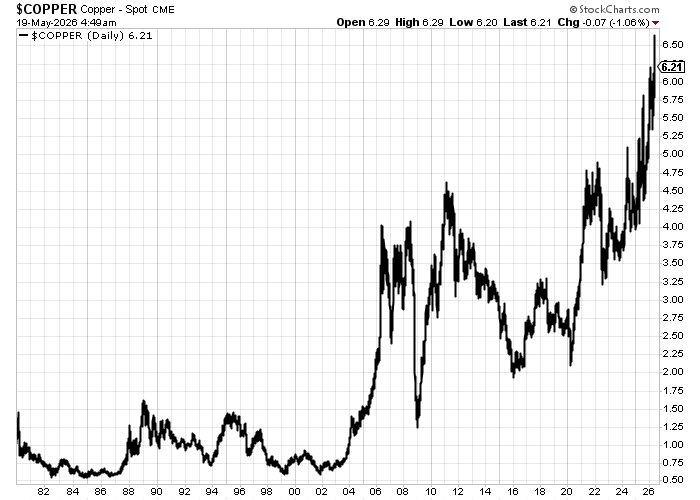
The really striking thing about the chart is the speed of the rallies when they come. Then the amount of time copper spends going nowhere.
Now here’s the ten-year chart, with the one-year moving average in red and the 55-day moving average in blue.
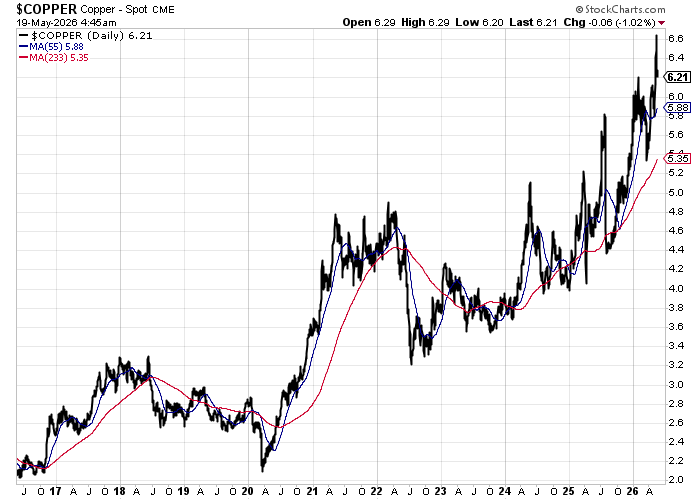
To my eye, copper appears to have formed a major bottom in 2020 during the Covid panic. The violent correction in 2022 increasingly looks like an early-cycle shakeout.
Technically, the chart is undeniably bullish. Copper is trading above both moving averages, both of which are rising strongly. Momentum remains positive.
That said, in the short term, the metal does look extended. Sentiment has become hyper bullish. Every investment bank now seems to have a copper supercycle note. Type “copper” into X and see what comes up: we are going to the moon on a copper superjet (powered by electricity natch).
Now here’s the three-year chart, to which I’ve added the 50- and 200-day moving averages and the RSI. The trend is your friend, and it is up.
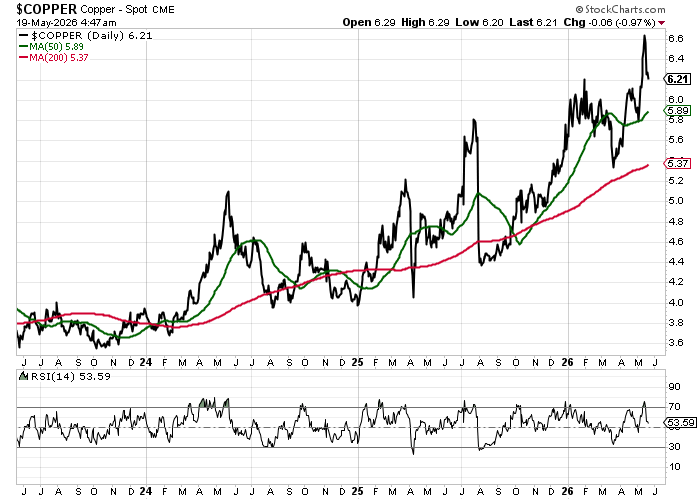
Historically, copper tends to be seasonally weaker over the summer months, and this is a spiky chart within its uptrend. I think we see some range-trading and consolidation over the summer months, which will provide something of a buying opportunity.
But the charts are only half the story.
The more interesting question is why copper may be entering an entirely new structural era.


